Difference between revisions of "Views"

m |
m (added Sensors) |
||
| Line 5: | Line 5: | ||
==Main Views== | ==Main Views== | ||
{| cellpadding ="10" | {| cellpadding ="10" | ||
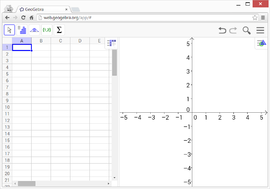
| − | |[[File:Algebra-View.png|link=| | + | |[[File:Algebra-View.png|link=|270px]] |
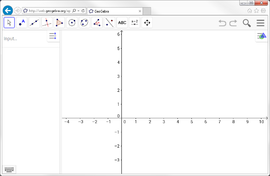
|[[File:Menu_view_algebra.svg|link=|Algebra View|24px]] [[Algebra View|'''''Algebra View''''']]: <br> | |[[File:Menu_view_algebra.svg|link=|Algebra View|24px]] [[Algebra View|'''''Algebra View''''']]: <br> | ||
Algebraic representations of objects are displayed and can be entered directly using the (virtual) keyboard (e.g. coordinates of points, equations). | Algebraic representations of objects are displayed and can be entered directly using the (virtual) keyboard (e.g. coordinates of points, equations). | ||
|- | |- | ||
| − | |[[File:Graphics-View-empty.png|link=| | + | |[[File:Graphics-View-empty.png|link=|270px]] |
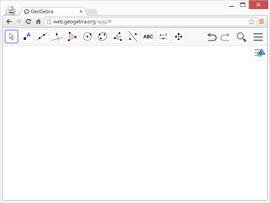
|[[File:Menu_view_graphics.png|link=|Graphics View|24px]] [[Graphics View|'''''Graphics View''''']]: <br> | |[[File:Menu_view_graphics.png|link=|Graphics View|24px]] [[Graphics View|'''''Graphics View''''']]: <br> | ||
Mathematical objects can be constructed with your mouse and changed dynamically afterwards. | Mathematical objects can be constructed with your mouse and changed dynamically afterwards. | ||
|- | |- | ||
| − | |[[File:3D-Graphics-View.png|left|link=| | + | |[[File:3D-Graphics-View.png|left|link=|270px]] |
|[[File:Perspectives_algebra_3Dgraphics.svg|link=|3D Graphics View|24px]] [[3D Graphics View|'''''3D Graphics View''''']]: <br> | |[[File:Perspectives_algebra_3Dgraphics.svg|link=|3D Graphics View|24px]] [[3D Graphics View|'''''3D Graphics View''''']]: <br> | ||
Three dimensional mathematical objects can be constructed and changed dynamically. | Three dimensional mathematical objects can be constructed and changed dynamically. | ||
|- | |- | ||
| − | |[[File:CAS-View.png|left|link=| | + | |[[File:CAS-View.png|left|link=|270px]] |
|[[File:Menu_view_cas.svg|link=|CAS View|24px]] [[CAS View|'''''CAS View''''']]: <br> | |[[File:Menu_view_cas.svg|link=|CAS View|24px]] [[CAS View|'''''CAS View''''']]: <br> | ||
GeoGebra's Computer Algebra System can be used for numerical and symbolic computations. | GeoGebra's Computer Algebra System can be used for numerical and symbolic computations. | ||
|- | |- | ||
| − | |[[File:Spreadsheet-View.png|left|link=| | + | |[[File:Spreadsheet-View.png|left|link=|270px]] |
|[[File:Menu_view_spreadsheet.svg|link=|Spreadsheet View|24px]] [[Spreadsheet View|'''''Spreadsheet View''''']]: <br> | |[[File:Menu_view_spreadsheet.svg|link=|Spreadsheet View|24px]] [[Spreadsheet View|'''''Spreadsheet View''''']]: <br> | ||
You can work with data and explore statistical concepts. | You can work with data and explore statistical concepts. | ||
| Line 30: | Line 30: | ||
[[File:Menu_view_probability.svg|link=|24px]] [[Probability Calculator|'''''Probability Calculator''''']]: Allows you to easily calculate and graph probability distributions. | [[File:Menu_view_probability.svg|link=|24px]] [[Probability Calculator|'''''Probability Calculator''''']]: Allows you to easily calculate and graph probability distributions. | ||
| + | |||
| + | '''''Sensors''''': Allows you to collect data from a mobile device´s sensors using the GeoGebra Sensors App. | ||
Revision as of 09:28, 3 September 2015
What are Views
GeoGebra provides different Views for mathematical objects, which are displayed in different representations (e.g. algebraic and graphical) and are linked dynamically. This means that if you modify an object in any of the Views, its representations in the other Views automatically adapt to these changes if possible.
Main Views
|
Algebraic representations of objects are displayed and can be entered directly using the (virtual) keyboard (e.g. coordinates of points, equations). |
|
Mathematical objects can be constructed with your mouse and changed dynamically afterwards. |
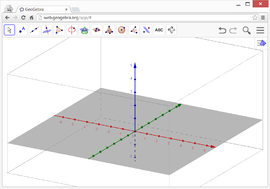 |
Three dimensional mathematical objects can be constructed and changed dynamically. |
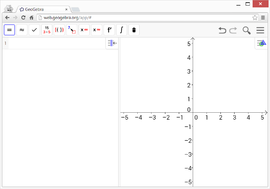 |
GeoGebra's Computer Algebra System can be used for numerical and symbolic computations. |
 |
You can work with data and explore statistical concepts. |
Other Display Features
![]() Construction Protocol: This interactive list of your construction steps allows you to redo your construction step by step.
Construction Protocol: This interactive list of your construction steps allows you to redo your construction step by step.
![]() Probability Calculator: Allows you to easily calculate and graph probability distributions.
Probability Calculator: Allows you to easily calculate and graph probability distributions.
Sensors: Allows you to collect data from a mobile device´s sensors using the GeoGebra Sensors App.