Waarschijnlijkheidrekening Macro: verschil tussen versies

| Regel 1: | Regel 1: | ||
<noinclude>{{Manual Page|version=4.0}}</noinclude>{{tool|type=special object|Waarschijnlijkheidrekening|icon=Tool_Probability_Calculator.gif}} | <noinclude>{{Manual Page|version=4.0}}</noinclude>{{tool|type=special object|Waarschijnlijkheidrekening|icon=Tool_Probability_Calculator.gif}} | ||
| − | + | ''Waarschijnlijkheidrekening'' is een van de schermindelingen van GeoGebra. Je kunt het gebruiken om te berekeningen en grafieken te maken van kansdichtheidsfunctie, of voor statistisch onderzoek. | |
{| cellpadding ="10" | {| cellpadding ="10" | ||
| Regel 9: | Regel 9: | ||
|} | |} | ||
| − | == | + | ==Verdelingen== |
Tab ''Distribution'' allows you to graph a variety of probability distributions. Just select the distribution you want to work with from the list available in the drop down menu (e.g. Normal, Binomial) and GeoGebra will graph it for you. Then, you may adjust the parameters of the distribution in the adjacent text boxes. | Tab ''Distribution'' allows you to graph a variety of probability distributions. Just select the distribution you want to work with from the list available in the drop down menu (e.g. Normal, Binomial) and GeoGebra will graph it for you. Then, you may adjust the parameters of the distribution in the adjacent text boxes. | ||
| Regel 16: | Regel 16: | ||
* [[File:interval-left.png|link=|16px]] [[File:interval-between.png|link=|16px]] [[File:interval-right.png|link=|16px]] Modify your graph in order calculate a cumulative probability (e.g. ''P(x ≤ X)'', ''P(x ≥ X)''). To calculate a probability select the interval type using the buttons provided. Then adjust the interval in the adjacent text boxes or drag the corresponding markers along the ''x''-axis in the graph. | * [[File:interval-left.png|link=|16px]] [[File:interval-between.png|link=|16px]] [[File:interval-right.png|link=|16px]] Modify your graph in order calculate a cumulative probability (e.g. ''P(x ≤ X)'', ''P(x ≥ X)''). To calculate a probability select the interval type using the buttons provided. Then adjust the interval in the adjacent text boxes or drag the corresponding markers along the ''x''-axis in the graph. | ||
| − | == | + | ==Statistiek== |
Tab ''Statistics'' allows you to conduct a variety of statistical tests. Just select the test you want to work with from the list available in the drop down menu (e.g. ''Z Test of a Mean'') and specify your ''Null Hypothesis'', as well as your ''Alternative Hypothesis''. Then, adjust the parameters of your test in the provided text boxes and GeoGebra will automatically provide the results of your statistical test. | Tab ''Statistics'' allows you to conduct a variety of statistical tests. Just select the test you want to work with from the list available in the drop down menu (e.g. ''Z Test of a Mean'') and specify your ''Null Hypothesis'', as well as your ''Alternative Hypothesis''. Then, adjust the parameters of your test in the provided text boxes and GeoGebra will automatically provide the results of your statistical test. | ||
| − | == | + | ==Opmaakwerkbalk== |
The ''Probability Calculator Stylebar'' provides options to [[File:normal-overlay.png|link=|16px]] overlay your distribution with the ''Normal Curve'' and to [[File:export16.png|link=|16px]] export the graph. | The ''Probability Calculator Stylebar'' provides options to [[File:normal-overlay.png|link=|16px]] overlay your distribution with the ''Normal Curve'' and to [[File:export16.png|link=|16px]] export the graph. | ||
Versie van 28 apr 2015 13:56
Sjabloon:Manual PageSjabloon:Tool Waarschijnlijkheidrekening is een van de schermindelingen van GeoGebra. Je kunt het gebruiken om te berekeningen en grafieken te maken van kansdichtheidsfunctie, of voor statistisch onderzoek.
|
|
Verdelingen
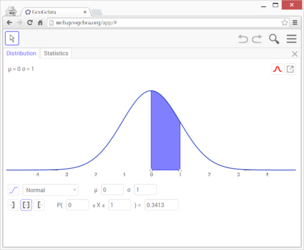
Tab Distribution allows you to graph a variety of probability distributions. Just select the distribution you want to work with from the list available in the drop down menu (e.g. Normal, Binomial) and GeoGebra will graph it for you. Then, you may adjust the parameters of the distribution in the adjacent text boxes.
You may also use the buttons provided in order to change the appearance of the distribution:
 Toggle between the probability density function and the cumulative distribution function of the distribution

 Modify your graph in order calculate a cumulative probability (e.g. P(x ≤ X), P(x ≥ X)). To calculate a probability select the interval type using the buttons provided. Then adjust the interval in the adjacent text boxes or drag the corresponding markers along the x-axis in the graph.
Statistiek
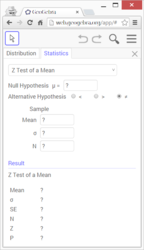
Tab Statistics allows you to conduct a variety of statistical tests. Just select the test you want to work with from the list available in the drop down menu (e.g. Z Test of a Mean) and specify your Null Hypothesis, as well as your Alternative Hypothesis. Then, adjust the parameters of your test in the provided text boxes and GeoGebra will automatically provide the results of your statistical test.
Opmaakwerkbalk
The Probability Calculator Stylebar provides options to ![]() overlay your distribution with the Normal Curve and to
overlay your distribution with the Normal Curve and to ![]() export the graph.
export the graph.
Drag and Drop: In GeoGebra Desktop, you may use Drag and Drop in order to transfer the plot of your distribution either to the Graphics View or to another application that will accept images. Just position the mouse at the top of the Probability Calculator screen and the cursor will change to a hand cursor. This new cursor allows you to drag the plot into Graphics View 1 or 2 to create a new plot or to drag an image of the plot into another application.